Biking by the Numbers: San Francisco’s 2019 Biking Statistics
Bicycling moves people around San Francisco using less space per person than when people go by driving. The SFMTA encourages bicycling and makes yearly ridership and trend data public. While Bike-to-Work day has moved to September this year due to the ongoing pandemic, we are excited to share San Francisco’s 2019 citywide bicycling data that we usually release in May.
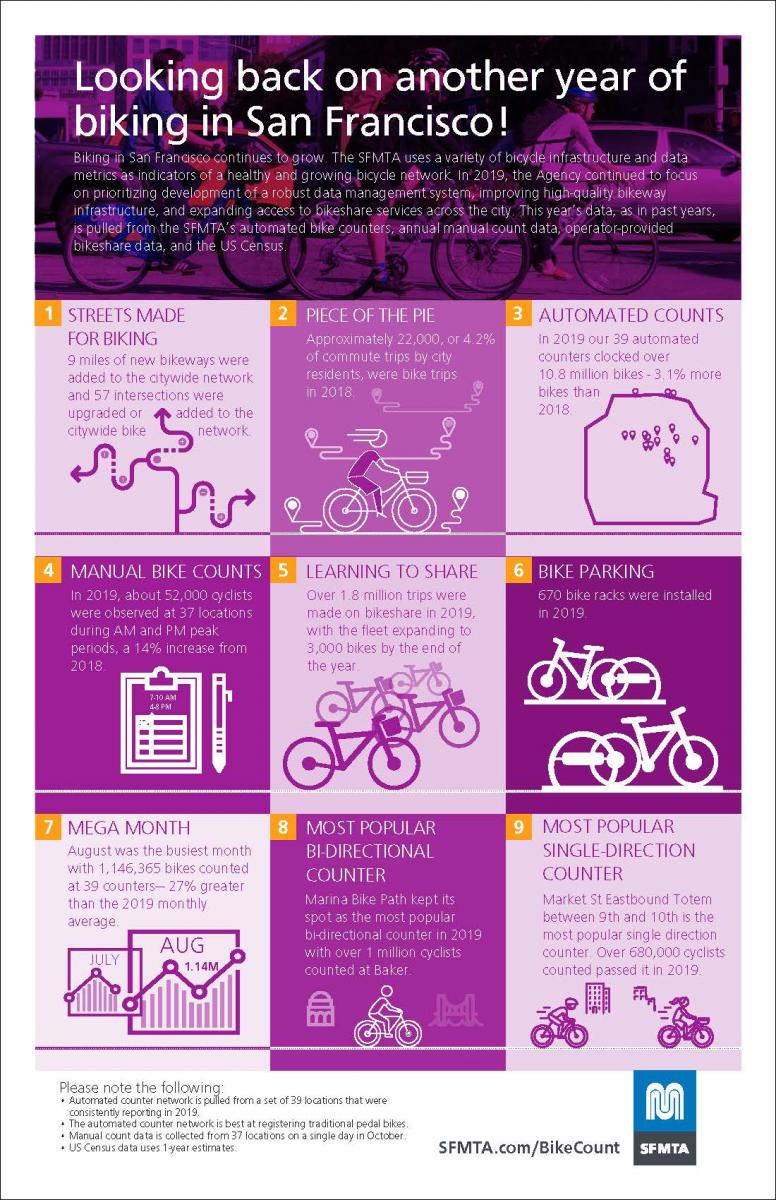
The SFMTA uses a variety of bicycle infrastructure and data metrics as indicators of a healthy and growing bicycle network. In 2019, the Agency prioritized the development of a robust data management system, improving high-quality bikeway infrastructure to make bicycling less stressful and more appealing, and expanding access to bikeshare services across the city. As in past years, 2019 data is pulled from the SFMTA’s automated bike counters, annual manual count data, operator-provided bikeshare data, and the US Census. Here are some key findings from 2019 bike data:
- Streets Made for Biking: 9 miles of new bikeways were added to the citywide network and 57 intersections were upgraded or added to the citywide bike network.
- Piece of the Pie: Approximately 22,000, or 4.2% of commute trips by city residents, were bike trips in 2018.
- Automated Bike Counts: In 2019 our 39 automated counters clocked over 10.8 million bikes - 3.1% more bikes than 2018.
- Manual Bike Counts: In 2019, about 52,000 cyclists were observed at 37 locations during AM and PM peak periods, a 14% increase from 2018.
- Learning to Share: Over 1.8 million trips were made on bikeshare in 2019, with the fleet expanding to 3,000 bikes by the end of the year.
- Bike Parking: 670 bike racks were installed in 2019.
- Mega Month: August was the busiest month with 1,146,365 bikes counted at 39 counters— 27% greater than the 2019 monthly average.
- Most Popular Bi-Directional Counter: Marina Bike Path kept its spot as the most popular bi-directional counter in 2019 with over 1 million cyclists counted at Baker.
- Most Popular Single Direction Counter: Market St Eastbound Totem between 9th and 10th is the most popular single direction counter. Over 680,000 cyclists counted passed it in 2019.
A notable change in 2019 includes reprioritizing the locations of our automated counter network. Since 2016, the SFMTA managed over 70 automated counter locations. This extensive network of sensitive technology embedded in the road makes it difficult to maintain and vulnerable to damage partially from normal wear-and-tear as well as on-going construction, weather, and other conditions. Reducing the network down to 39 strategic locations along the city’s bikeway network helps ensure reliable and consistent data with fewer maintenance issues or infrastructure problems. Similarly, we prioritized improving our on-line automated counter data dashboards, with expanded quality assurance processing of incoming data and faster reporting times. Moving forward in 2020, ridership data will be updated monthly Together, these improvements will make our citywide biking data more accessible to the public and help our planning efforts.
While this summary presents data from 2019 alone, looking ahead to 2020, this year’s significant events have already shaped citywide mobility trends. This includes the current shelter-in-place order which has changed daily routines, with new trends emerging from altered travel and traffic patterns. We also saw an increase in bicycling trips on Market Street shortly after the implementation of car-free Better Market Street. The quick-build treatments installed in January 2020 elevated safety and comfort for bicyclists by restricting private automobile through-traffic.
The SFMTA’s bike count summary provides insight into San Francisco’s shifting travel patterns. Releasing this annual data is one way we aim to keep the public informed about our projects and programs. As 2020 data becomes available, we look forward to sharing how our changing world has impacted this important mode of travel.