Bicycling San Francisco
More people are turning to bicycles for their everyday travel around San Francisco. (See city bike ridership data.) And we’re keeping up with the biking demand by building dedicated bike lanes, supporting bike culture and making streets safer and more comfortable for everyone.
For a Bike-Friendly City


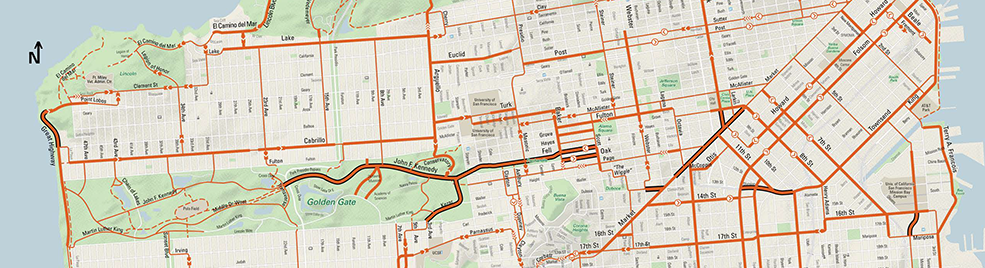
Bike Map
SFMTA's San Francisco Bike Map