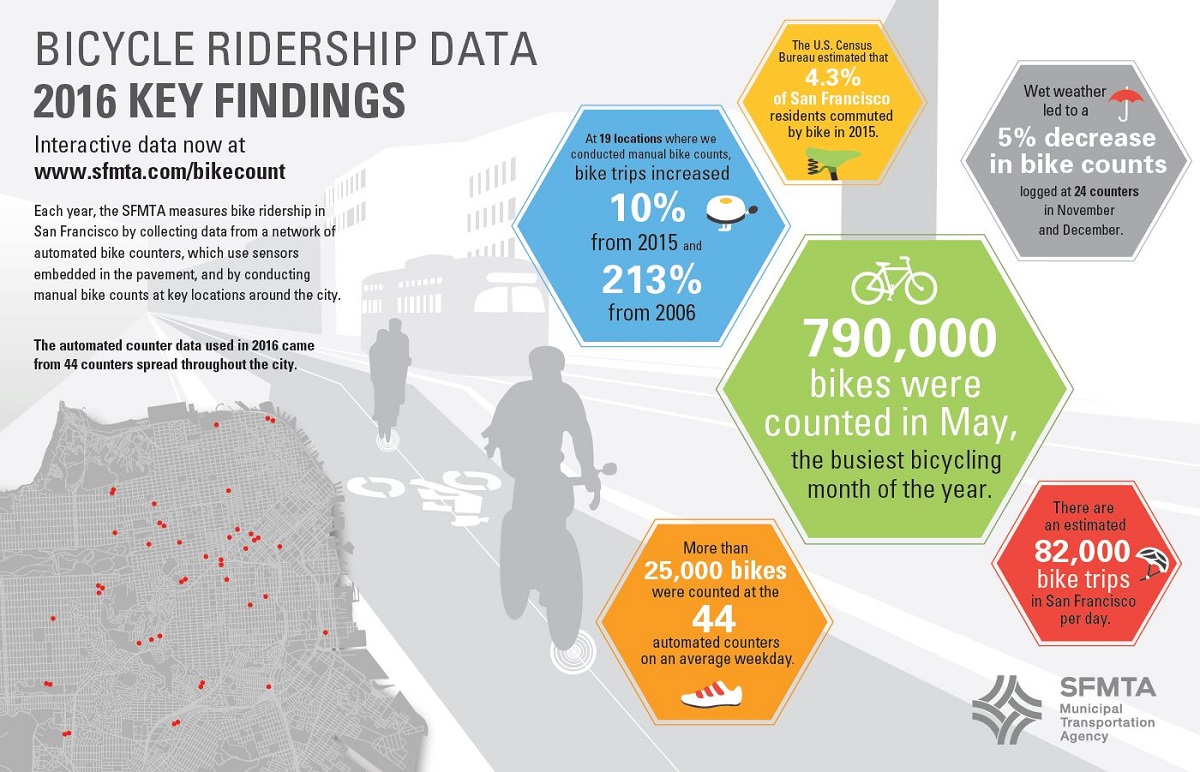
Bicycle Counts: Key Findings in 2016
Each year, the SFMTA measures bicycle ridership in San Francisco by collecting data from a network of automated bike counters, which use sensors embedded in the pavement, and by conducting manual bike counts at key locations around the city.
Here are our highlights from bike count data collected in 2016:
- On an average day, there were an estimated 82,000 bike trips in San Francisco.
- On an average weekday, more than 25,000 bikes were counted at the 44 automated counters.
- 790,000 bikes were counted in May, the busiest bicycling month of the year.
- At 19 locations where we conducted manual bike counts, bike trips increased 10 percent from 2015 and 213 percent from 2006.
- Wet weather led to a 5 percent decrease in bike counts logged at 24 counters in November and December (compared to 2015).
- Bike commute trips in the morning peaked at 8 a.m., while evening commute trips were more spread out from 3 to 7 p.m.
Share of Commute Trips Made By Bike
In 2015*, 4.3 percent of commute trips in San Francisco were regularly made by bike. That number has increased from 2.3 percent since 2006.
*Commute habits are measured each year in the U.S. Census Bureau's American Community Survey, the latest data available from which comes from 2015.
Contact Information
Tori Winters