Six months after the first speed cameras were installed in San Francisco, our studies show drivers are slowing down.
It’s been six months since the first cameras in the SFMTA’s Speed Safety Camera Program were activated. In that time, we have seen a major decrease in speeding on city streets equipped with automated speed enforcement cameras.
Today, we are releasing the data from our most recently completed speed study. The study analyzed speeding at 15 key locations before and after we installed our cameras. It shows that speeding has decreased by 72% on average at these locations.
We are also releasing speed camera warning and ticket data from June, July and August.
Study Data
Our study demonstrates that our speed cameras are making a positive impact on speeding in the city.
Before installing our cameras, the SFMTA measured the speed of San Francisco drivers at all 33 locations in our automated speed enforcement network. We now have post-installation speed measurements for 15 of those locations. This adds an extra layer of monitoring and analysis for driving behavior and can work as a backup while we implement this new pilot technology.
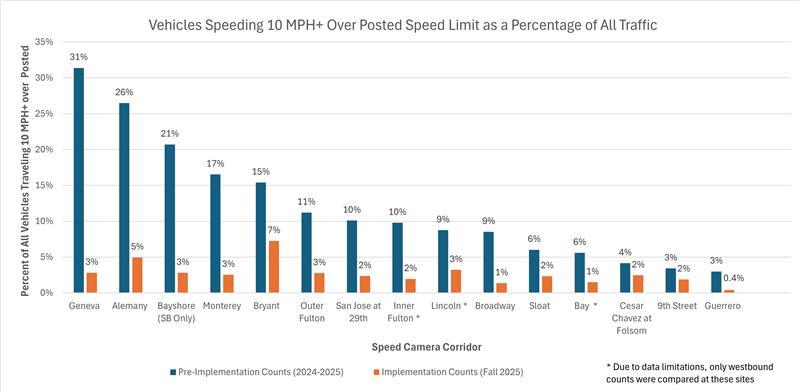
The new data was collected in September. In the graph below, you can see just how much speeding has decreased at these 15 locations.

We conducted pneumatic tube measurements at 15 locations within the Speed Safety Camera network both before and after implementation.
A significant decline in speeding
On average, there was a 72% reduction in speeding vehicles across these 15 sample sites.
Here are a few other key statistics from our latest speed study:
- Approximately 20,000 fewer vehicles are speeding at these locations every single day.
- Generally, there has been a 4 MPH drop in average speeds at all 15 sample sites since the installation of our cameras.
- Before speed cameras were installed, 12 of these 15 locations had average speeds higher than the posted speed limit. Today, average speed is below the posted speed limit at all 15 locations.
How we tracked the change
We used pneumatic tubes, which are two small tubes placed in the road and spaced a specific distance apart, to measure the speed of passing vehicles at all our camera locations before the installation of the network.
We did this to establish a baseline for driver behavior before starting the program. We are using the same method to track changes in driver behavior now that all our cameras have been installed. We will continue using pneumatic tubes to collect speed data near our speed cameras – including at the remaining 18 locations.
This method of speed testing has a long and reliable track record. It is recognized as a standard in the field of traffic safety.
Warning and citation data
In June, July and August, the SFMTA sent out a combined 260,142 warnings and citations to drivers who were observed travelling 11 MPH or more over the posted speed limit.
This period covers the program’s official 60-day warning period and the first full month that we issued citations.
These speeding events were captured by cameras at 33 locations across the city.
Here is the warning and citation breakdown by month:
- June 2025: 66, 887 warnings only
- July 2025: 149,506 warnings only
- August 2025: 43,749 warnings and 16,555 citations
Note about the warning and citation data: In June and July, during the 60-day warning period, we faced two key challenges that led us to issue fewer warnings than actual speeding events, including limited staff resources for required manual review and a software update that made the screening process more conservative. This is one of the reasons why a warning period was built into the launch of this program.
All revenue generated by the Speed Safety Camera Program will be used to recover the cost of maintaining our automated speed enforcement network — and to fund street safety programs, like traffic calming and road improvements.
Zooming in on the data that our speed cameras have collected, we also noticed some other encouraging trends, including:
- Week-over-week declines: Each week since July, we have issued fewer violations than the week before.
- Declining average speeds: The average speed for an issued violation has dropped each month between June and August.
- Repeat offenders are less common: So far, two-thirds of vehicles that have received a violation warning or citation have not received a second.
Safety, privacy and accountability
The primary goal of the Speed Safety Camera Program has always been to make our streets safer.
Speeding cars are the leading cause of severe injuries and fatalities in San Francisco. And getting drivers to slow down saves lives.
San Francisco is the first city in the state to implement an automated speed enforcement pilot program under California Assembly Bill 645. We are proud to be leading the state in adopting this life-saving technology.

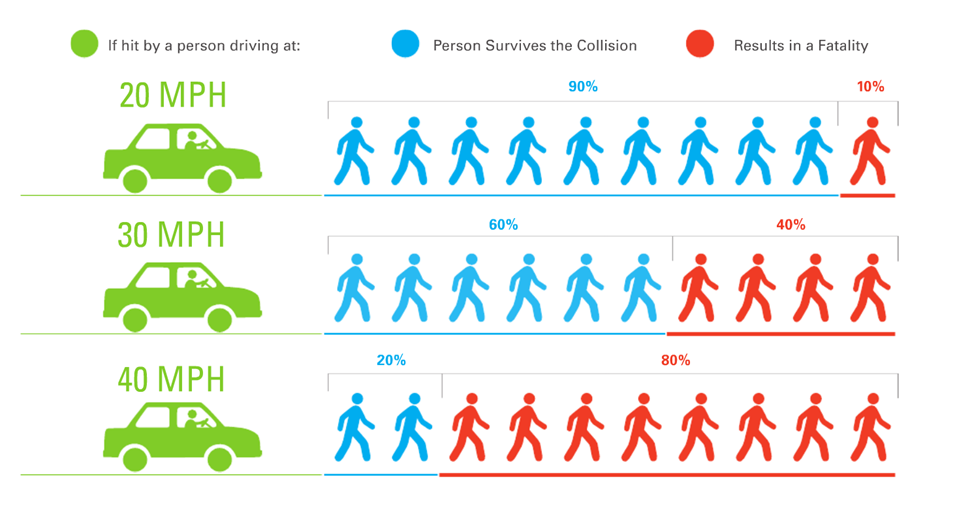
Studies show that slower driving speeds save lives.
In the six months since our first cameras were activated, we’ve learned a lot about how automated speed enforcement works under AB 645.
Working with our vendor, we helped pioneer a system that discourages speeding and complies with AB 645’s strict privacy and public accountability regulations. Here are some of the ways we are meeting the law’s requirements:
- Our cameras only take still photos. They do not record video or capture images of driver’s faces. The use of facial recognition technology is prohibited.
- Every suspected speeding violation is reviewed by SFMTA staff. If staff cannot visually confirm that a violation has occurred, the case is dismissed, and the photos are promptly destroyed.
- When a violation is confirmed, the SFMTA must issue a warning or citation within 14 days. Otherwise, the case will be dismissed, and all photos will be promptly destroyed.
As the SFMTA moves forward with our Speed Safety Camera Program, we will continue to closely monitor our network.
We will release citation figures and the results of more traffic studies — like the results we are sharing today — on a quarterly basis. After our cameras have been in place for 18 months, we will conduct an in-depth analysis of the program’s effectiveness, based on a full year of data. We expect to release that analysis in late 2026.
For more information and to sign up for updates, visit the Speed Safety Program project page.
Comments are for the English version of this page.