A lot of San Franciscans only need to drive sometimes. If you can mostly get around by foot, bike and transit, you might not need to own a car, but would like to still have a convenient option to drive for the occasional mountain hike or furniture shopping.
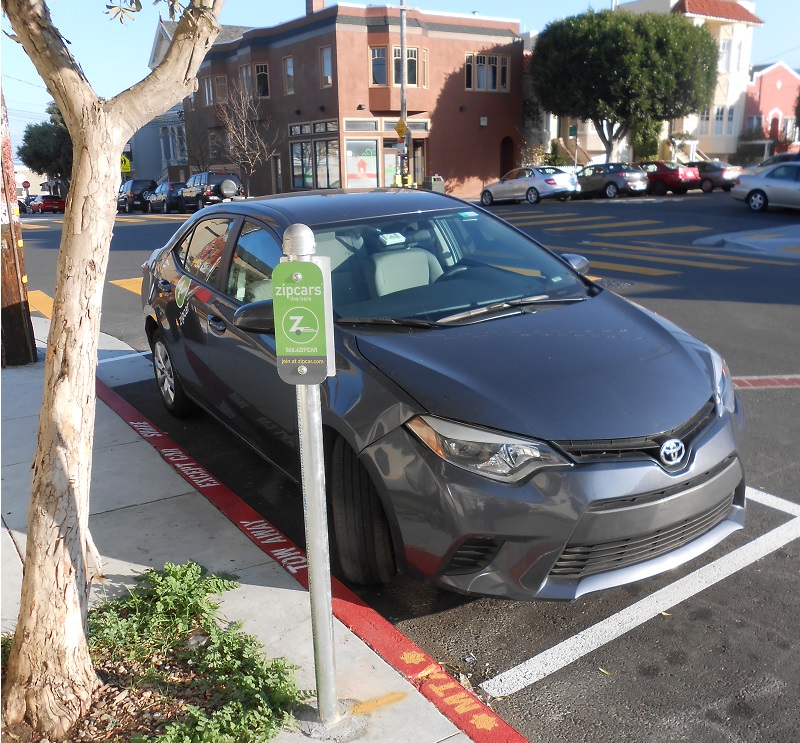
That’s why we’ve seen the recent rise of car sharing: Cars you can rent near your home, for those who don’t want to own a whole car - just “enough” car.
Car sharing services give people the flexibility they need to sell their car (or forego buying one). In turn, it frees up parking spaces for those who need them most.
But just how many people use each car-share vehicle? And as we bring more on-street car-share parking spaces to make it convenient for more people, how do we best foster these services to benefit everyone in the city?
These are the kinds of questions we explored in our new On-Street Car Sharing Pilot Program Evaluation Report [PDF]. Through this pilot program, since 2014 we’ve permitted about 200 dedicated curbside parking spaces to car sharing services around the city to supplement the spaces in parking garages and lots.
The report lays out our findings on how San Franciscans use these vehicles, what effect that has on the city and the ways we might be able to improve the program.
Here are a few highlights.
1. The average on-street car-share vehicle is used by 19 people.
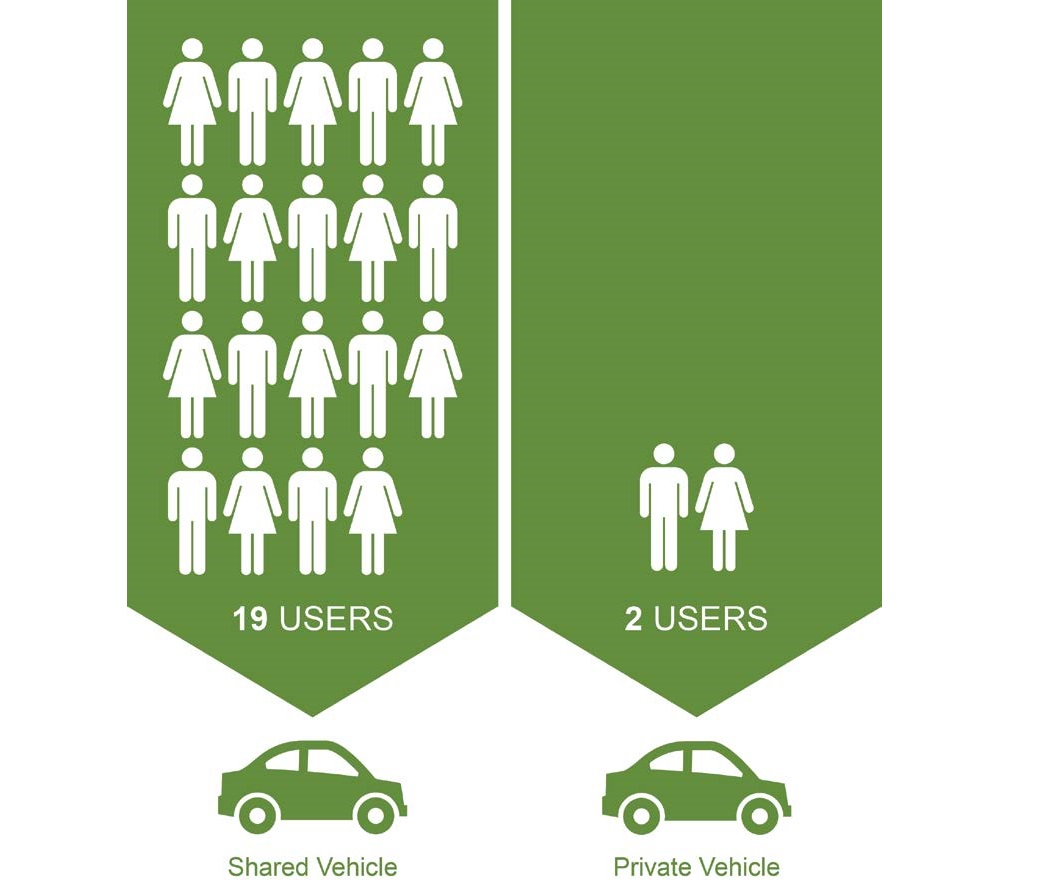
The answer to the earlier question, by the way, is 19. That’s the average number of different people who use a car-share vehicle each month. Some cars are driven regularly by as many as 50 people.
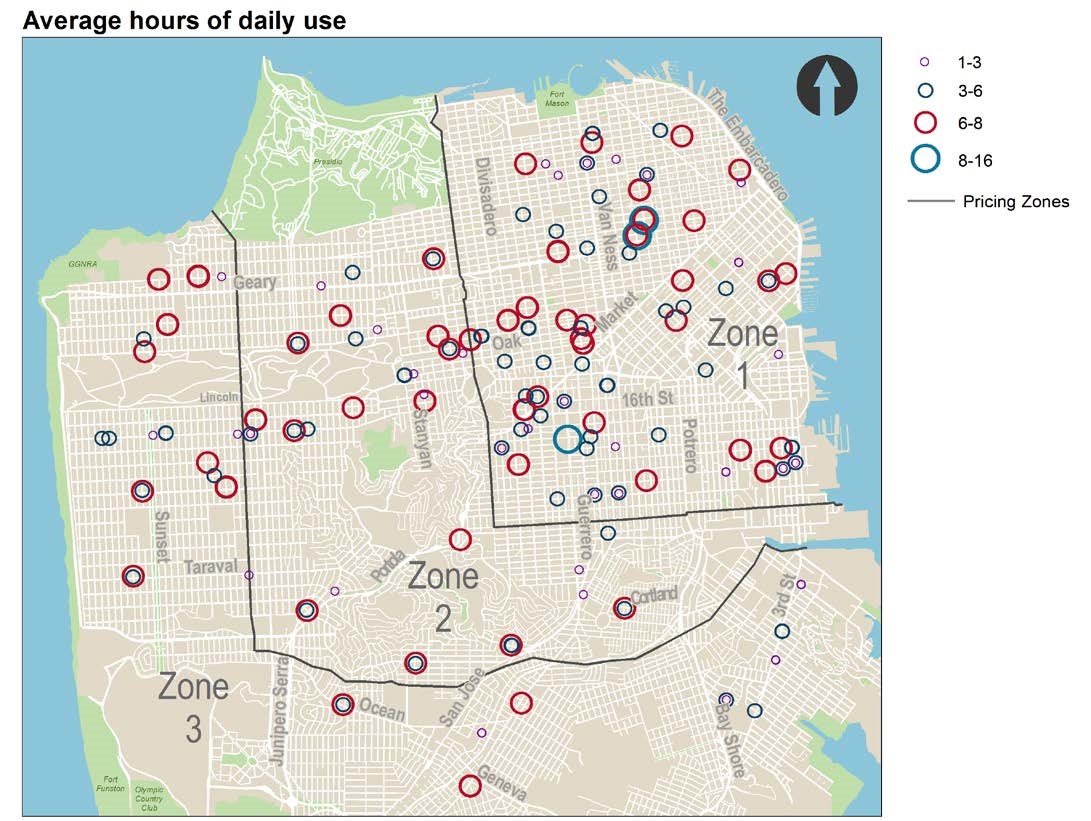
2. The average on-street car-share vehicle is used for six hours a day.
Of the 24 hours in a day, most privately-owned cars spend 23 of them parked and unused.
The average car-share vehicle in SF, on the other hand, is used for six hours. Some shared cars are used for as many as 16 hours, which means they spend more time out of their dedicated parking spot than in it.
3. On-street car sharing is in demand even in outer neighborhoods.
Car sharing isn’t just for the most dense, walkable neighborhoods in the inner part of the city. Even in neighborhoods like the Outer Sunset and Outer Mission, car-share vehicles are used by about 30 different people.
As part of the permit program, we included measures to help ensure on-street car-share vehicles were made available widely. Of the three zones we designated in the city, we required car sharing organizations to provide at least 15 percent of their vehicles in each of the two outer zones.
Moving On-Street Car Sharing Forward
On-street car-sharing is growing in American cities about as fast as the body of research on it. We collected this data and thousands of survey responses to broaden that research and add local depth.
And overall, our findings matched those of widely-cited reports like UC Berkeley’s study in 2010, which found that in cities nationwide, the average car-share vehicle replaces as many as 13 privately-owned cars.
With this report, we’ll continue to drill down on a range of issues: From how to ensure car sharing is available to low-income residents, whether to permit “one-way” car sharing services and how to keep car-share vehicles available when curb space is occupied for construction work.
By April, we expect to bring a proposal to the SFMTA Board of Directors to approve a permanent permit program for on-street car sharing. See the On-Street Car Sharing Pilot Project webpage for the full report and to sign up for updates.