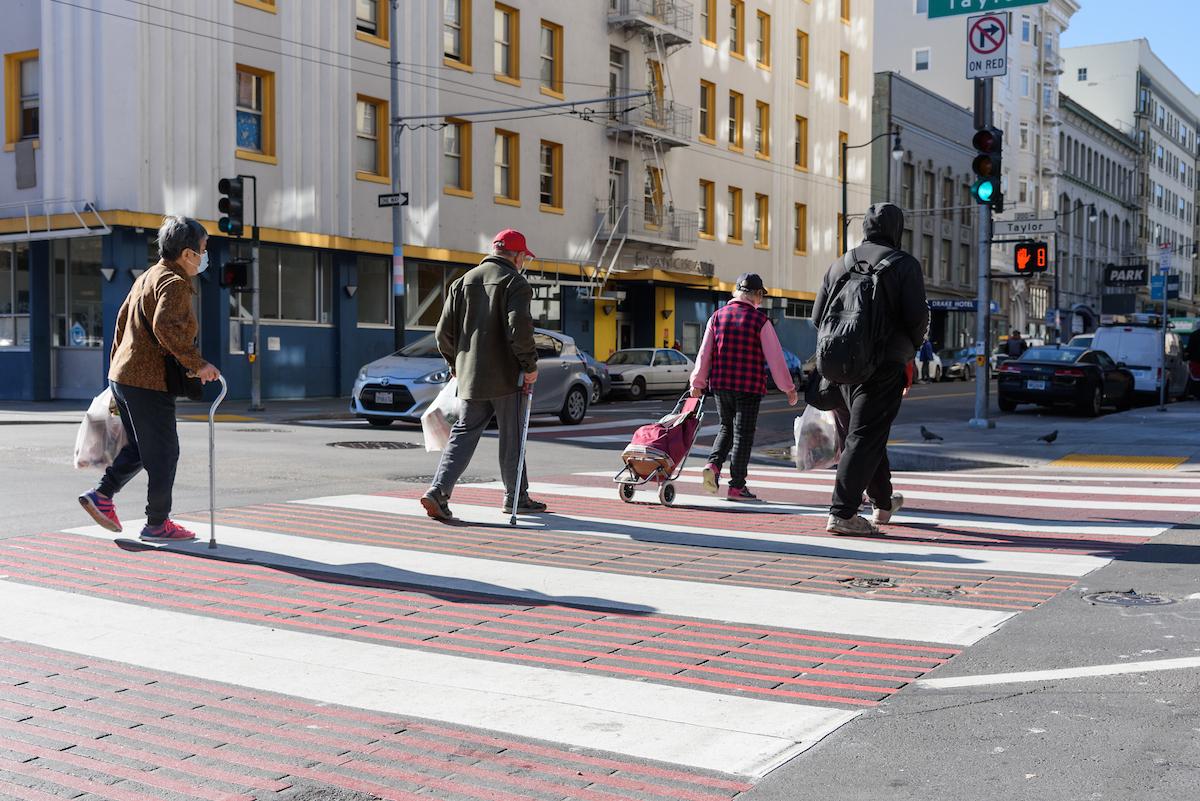
Our speed camera pilot program is one way we're working to make streets safer for people walking, biking and driving around the city.
San Francisco’s new speed safety cameras issued more than 31,000 warnings in April alone — averaging over 1,000 per day. And these numbers will increase when we activate additional speed safety cameras early next month. Today, we got word that PG&E has given us preliminary approval to activate speed safety cameras at an additional 12 high-risk locations.
Early data from our pilot program is giving us the clearest picture yet of where, when and how fast people are speeding on our streets. Every warning is an opportunity to encourage safer driving and to gather valuable insights into speeding patterns across San Francisco.
As we actively monitor trends and take steps to address trouble spots, we want to share our findings with you.
We have launched a new public dashboard in partnership with DataSF. Here, you can find the most up to date information on speed patterns at camera locations, with monthly updates. This dashboard will allow both the public and city agencies to track progress — and monitor how driver behavior is shifting toward safer speeds.
What the April data shows
For a full webpage experience visit the DataSF Open Data Portal.
Streets with highest number of violations:
- Fulton between Arguello Boulevard and 2nd Avenue saw the highest number of speeding violations – 44% of the average daily total violations.
- Geary between Webster and Buchannan streets ranked second for average daily violations. It also saw the highest recorded speed (65 MPH in a 30 MPH zone).
Speeding behaviors:
- 77% of drivers who received warnings were going 11–15 MPH over the speed limit
- 19% of drivers who received warnings were going 16-20 MPH over the speed limit
- 4% of drivers who received warnings were going 21+ MPH over the speed limit
Timeframe trends:
- Morning rush is when speeding violations happen the most, with the highest number of violations occurring between 7 to 8 a.m.
- Tuesdays had the highest number of speeding violations.
While it’s too early to measure long-term behavior shifts, this first month of data provides an essential baseline to track progress.
Speeding remains a leading cause of severe injuries and deaths on our streets. That’s why we acted quickly to get this life-saving program underway as soon as possible, to be the first city in California to do so. Safer speeds make streets safer for everyone.

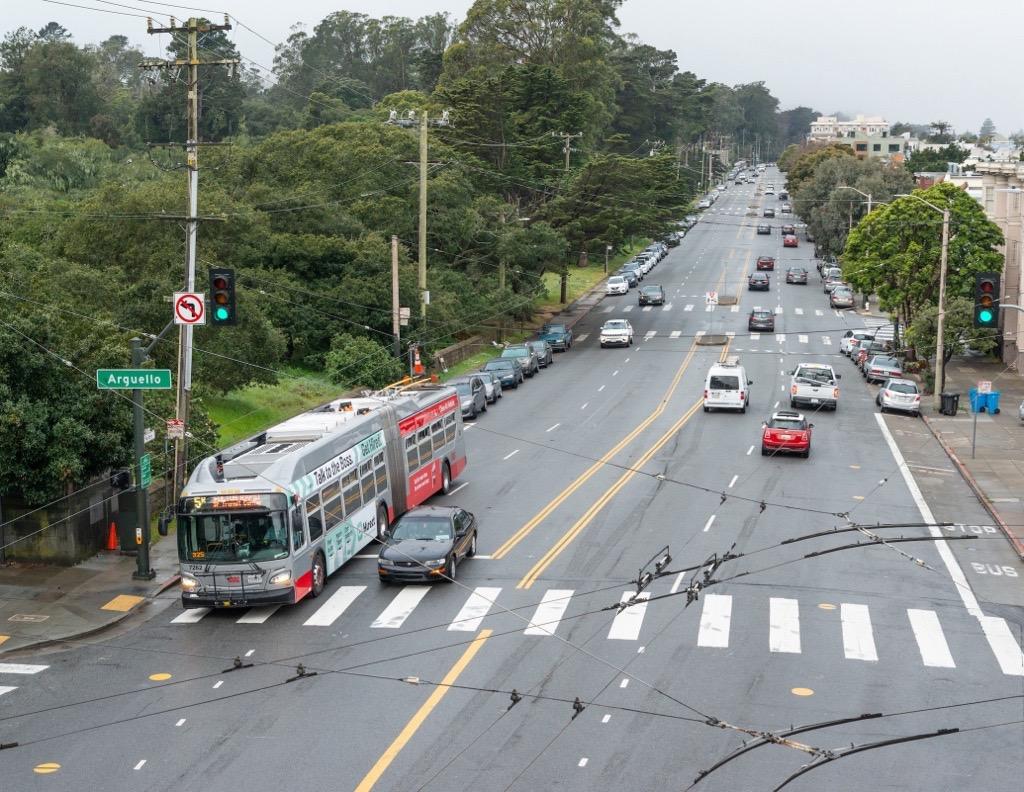
Fulton Street between Arguello Boulevard and 2nd Avenue saw the highest number of speeding violations through our pilot program.
Taking action now where data shows it is needed
Fulton between Arguello Boulevard and 2nd Avenue stands out for the sheer volume of violations. This block saw six times more average daily violations than the next most active location.
We have made a lot of engineering changes to improve safety on Fulton. However, the volume of warnings indicate that we need to take more action now to alert people driving to slow down.
We are:
- Installing more frequent and larger speed limit signs ahead of the camera.
- Adding speed limit pavement markings to remind drivers to slow down.
Data driven pilot
We use a data-driven approach to identify streets where speeding poses the greatest risk, especially to the most vulnerable people – children, seniors and people walking.
After reviewing a wide range of data, we set up cameras in areas with:
- Crash history: Streets with a record of severe or fatal speed-related collisions.
- Speeding patterns: Areas where drivers consistently exceed the speed limit, based on recent citywide speed studies.
- Vulnerable road users: Zones near schools, parks, senior centers, and commercial corridors — places where children, older adults, and people walking or biking are most at risk.
What’s next
We are currently issuing warnings based on the readings from speed safety cameras at 21 locations. We expect to activate cameras at an additional 12 locations in early June.
We appreciate our partnership with the Mayor’s Office, Public Utilities Commission and PG&E to power these critical street safety tools!
Here’s what you can expect:
- By early June, speed safety cameras at all 33 locations will be operational.
- Once the final camera receives power, the program will enter a citywide 60-day warning period before citations begin. We expect to start issuing citations beginning early August, 2025.
- Monthly data updates will continue throughout the five-year pilot.
- Additional speed studies are planned for later this summer.
Visit our Speed Safety Camera Program page and sign up for updates at SFMTA.com/SpeedCameras.
If you have any questions about the program, email us at SpeedCameras@sfmta.com.