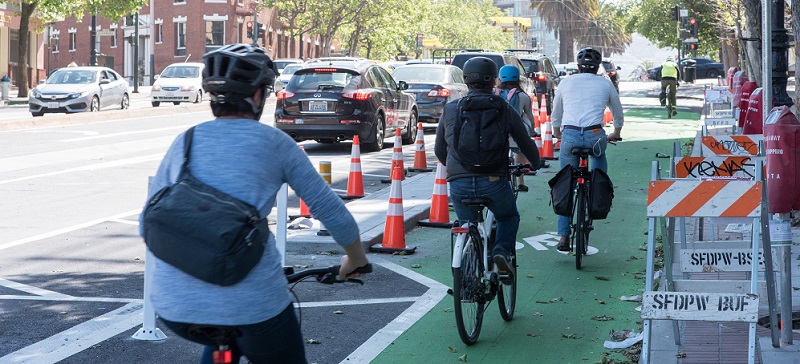
Upper Market St parking protected bikeway, one of the many key bike safety improvements.
Bicycling is a critical part of getting around San Francisco for many of our residents, workers and visitors.
With the growth of San Francisco, apparent in the amount of construction on our streets, making our streets safer for people biking has never been more important. As commuters come into the city, San Francisco swells with more than 1 million people on an average day! Each person on a bike is one less person in a traffic jam, competing for a parking spot or squeezing onto a crowded bus.
With every bikeway project being a critical step in the right direction towards a safer and more sustainable city, the SFMTA uses data to guide our investments for more livable streets.
Data allows us to answer questions like: Which type of infrastructure encourages bicycle ridership? When and where are we seeing more people biking?
Simply put, collecting data is critical to prioritizing our projects and evaluating the effectiveness of our work.
Each year, the SFMTA measures bicycle ridership in San Francisco by collecting data from a network of automated bike counters, which use sensors embedded in the pavement, and by conducting manual bike counts at key locations around the city.
Our release of bike ridership findings from the entirety of 2017 marks the second year of data released via our publicly accessible and interactive dashboards. We are also launching new efforts to release data more than once a year in 2018 due to the steady stream of information we get from our network of automated counters.
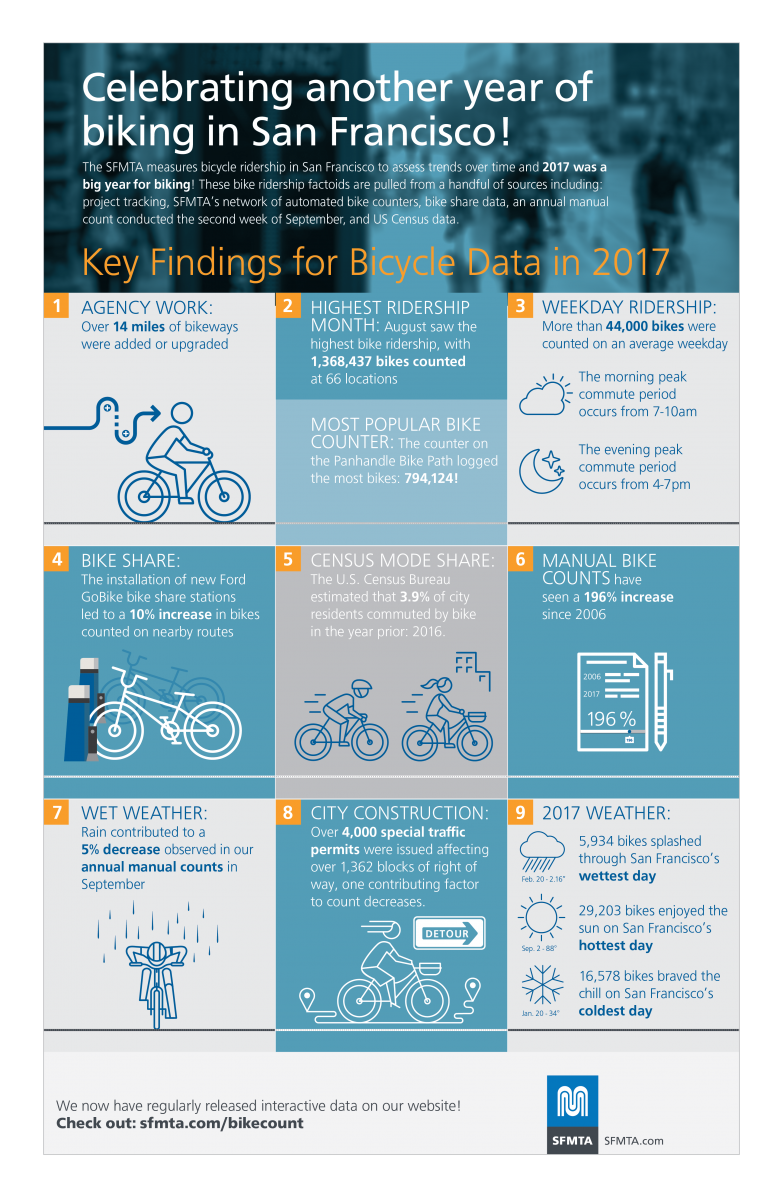
Here is a snapshot of what we learned about biking in San Francisco 2017.
- Last year over 14 miles of bikeways were added or upgraded.
- August saw the highest bike ridership with 1,368,437 bikes counted.
- More than 44,000 bikes were counted on an average weekday. The peak of the morning commute occurs from 8:30-9:00 a.m. and the peak of the evening commute from 5:30-6:00 p.m.
- The installation of new FordGoBike bike share stations led to a 10 percent increase in bikes counted on nearby routes. In the second half of 2017 alone, there were over 411,000 bike share trips of a little over a mile on average.
- The counter that logged the greatest number of bikes in 2017 was the Panhandle counter with 794,124 bikes!
- The most recent US Census ridership data from 2016 estimates 3.9 percent of commute trips were regularly made by bike.
- Although San Francisco is mostly temperate, the weather is sometimes reflected in automated count data. On the rainiest day in 2017, ridership was 21 percent below the daily average for that time of year.
For more information on the interactive bike count data dashboards and 2017 key findings go to sfmta.com/bikecount.