FINAL UPDATE: Delay on San Bruno btwn Harkness and Wilde has cleared. IB/OB 8/8AX and 9/9R resuming regular service. (More: 10 in last 48 hours)

Subway Performance Data

SFMTA.com/MetroData

About the Subway Performance Dashboards

Trains in Muni Metro’s subway are continually tracked by its Automatic Train Control System (ATCS). The ATCS automatically operates the trains, including accelerating, braking and opening the doors. The ATCS tracks the positions of the trains to within a few feet and reports the position to logs once every three to five seconds. To review what happened during each day SFMTA engineers are able to use the raw data from the train control system though the log files are encoded in a proprietary format.

These dashboards are based on this ATCS data. The metrics shown in the dashboards below inform our day-to-day management of Muni Metro service in the subway’s constrained operating environment are fundamental to future capacity expansion decisions.
 

Subway Travel Time (Measuring Reliability)

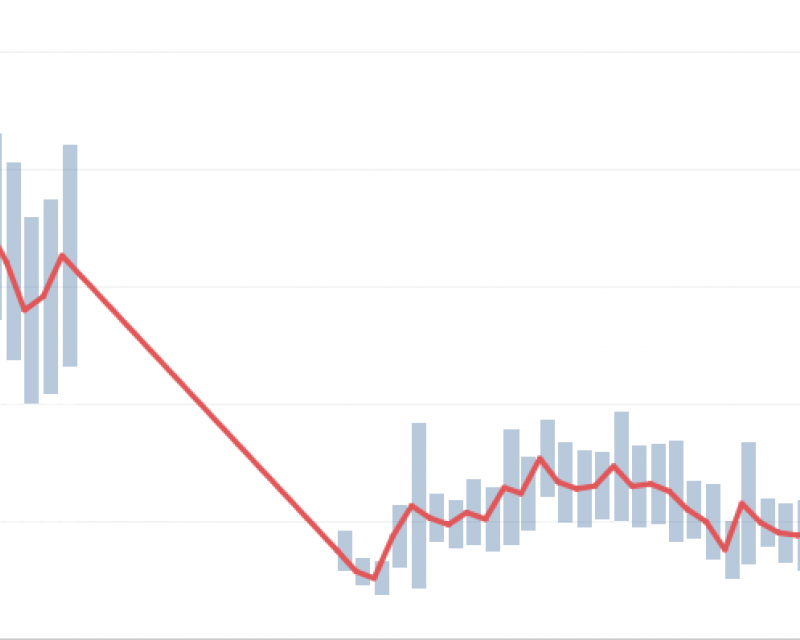
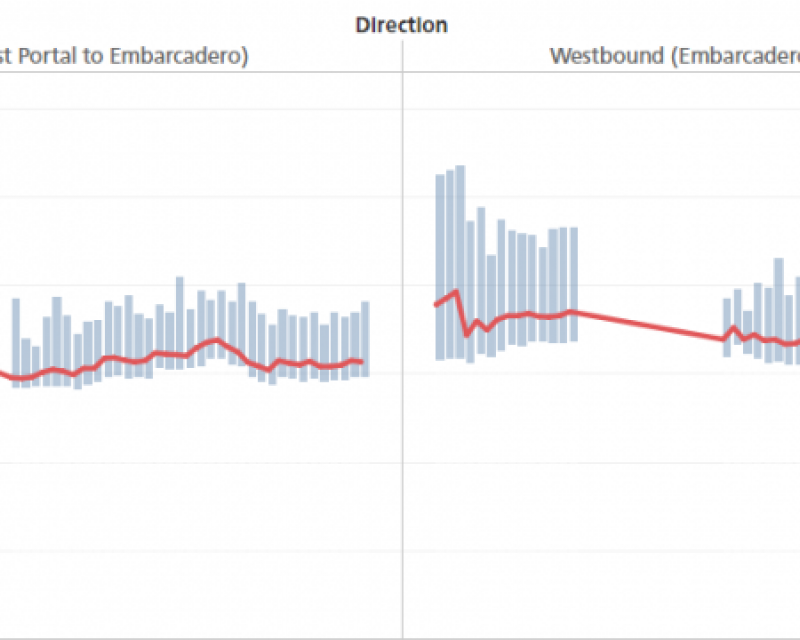
Subway Travel Time measures Muni Metro’s reliability. Subway Travel Time is a summary of every journey between Muni Metro’s West Portal and Embarcadero (Eastbound) stations, or Embarcadero to West Portal (Westbound), regardless of line. The journey time is measured from the time the doors of a train close at the origin station to the time the doors of the same train open at the destination station. Many riders remember their “worst trip” and in their minds use the travel time associated with that trip when figuring out how long it takes to get from point A to point B. Reducing this “worst case” trip makes Muni Metro more reliable and allows riders to budget less of their time to traveling.

Queuing (Measuring Delays)

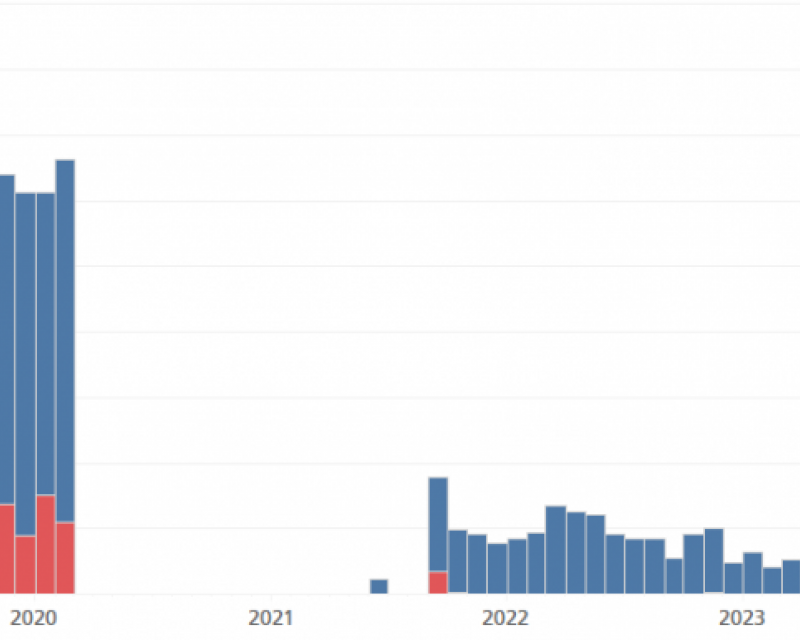
Queuing is another manifestation of delay in the subway and is a direct relation to an unpleasant rider experience: when trains are ”stuck” between stations. The chart represents how often trains are queued at Embarcadero station (eastbound) waiting to arrive at the station. Just like a crowded roadway, when more trains arrive at Embarcadero than can be sent out of the station, they begin to backup, or queue. Passengers remember this frustrating experience of sitting on the Muni Metro in the subway tunnel between stations or being able to see the platform out of the window, without being let off.

Average Daily Subway Delay (Assessing impact of delay on service quality)

Average Daily Subway Delay represents the total amount of delay in the subway, and the relative amount of delay compared to 2019 averages. The 2019 averages were deemed an unacceptable quality of service that are used to assess the impact of delays in recent months on the quality of service.

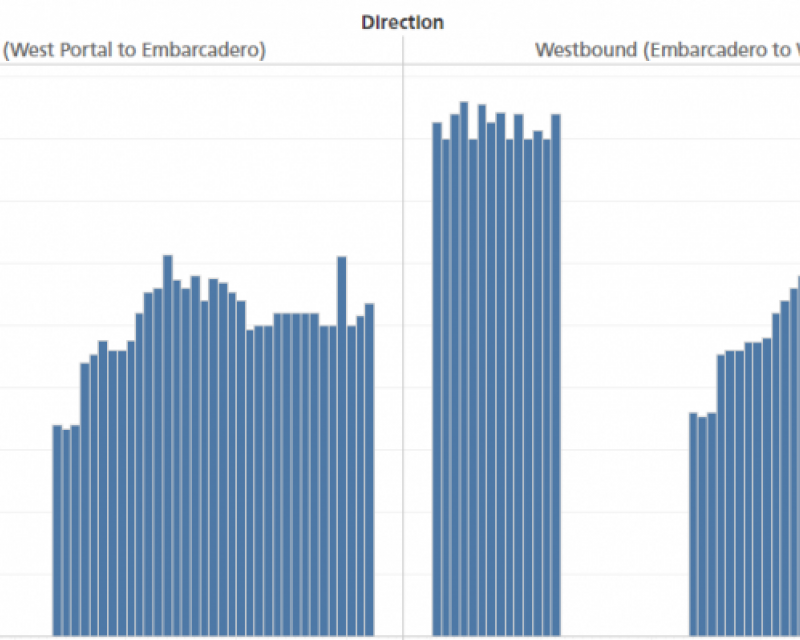
Subway Maximum Trains per Hour (The Variable)

Subway Maximum Trains per Hour shows the Muni Metro subway throughput (in number of trains per hour), also measured at Embarcadero station eastbound platform. This metric is an hourly count of the number of in-service trains that arrive at the platform. It is a measure of the subway’s capacity to move people. The more trains per hour, the more people can be moved during the period. Comparing the trains per hour to the other measurements of delay, queuing and travel times helps us understand how much “stress” the frequency of train arrivals puts on the system.