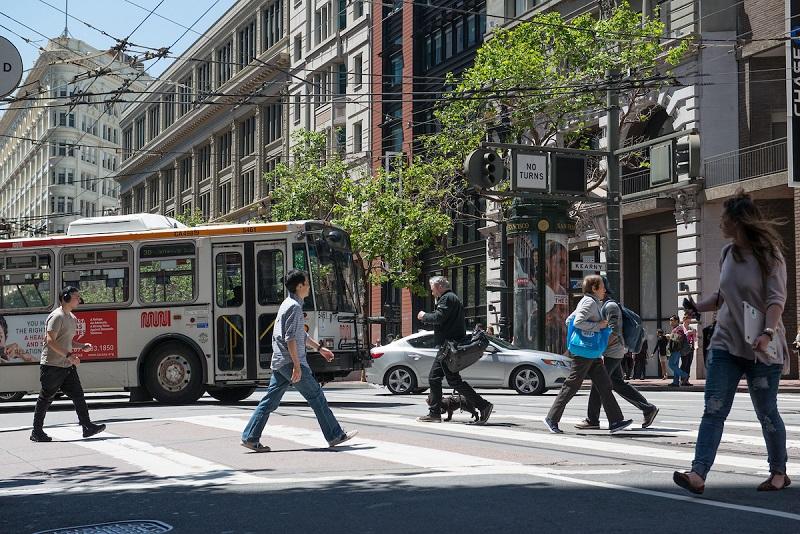
The way we travel around San Francisco continues to evolve towards a more sustainable future.
Since 2013, the SFMTA has monitored these trends by reporting the results of an annual survey about people's travel decisions and the reasons behind them. This helps us track our progress toward meeting our strategic goal of making transit, walking, bicycling, taxi, ride sharing and car sharing the preferred means of travel in San Francisco.
Making it easier for people to rely less on private automobiles is crucial if we're to achieve bold goals, such as Vision Zero – an end to traffic deaths – and dramatic reductions to greenhouse gas emissions that induce climate change.
The 2017 Travel Decision Survey [PDF] provides the latest findings from Fiscal Year 2017, which show that people continued to drive less each year and choose other options. On Tuesday, we will present these findings to the SFMTA Board of Directors.
With each year's survey, we compare our results with those from previous years to identify trends in how people get to work, school, shopping, dining and other activities.
Here are the key findings from our 2017 Travel Decision Survey.
Driving Continues to Decline
Since 2013, the percentage of trips made using private automobiles has declined from 50 percent to 43 percent. As such, San Francisco continued to exceed its goal calling for a majority of trips to be made using more sustainable means.
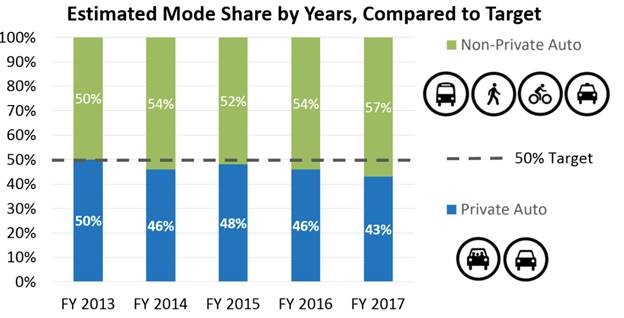
In fact, since the last fiscal year, the number of driving trips actually declined from 1.9 million to 1.8 million, even as San Francisco saw a 2 percent overall increase in the number of trips (made by any means), to 4.1 million.
Other Major Travel Trends
- Transit trips (26 percent) have remained steady since 2013. In the past year, they increased slightly among non-city residents.
- Walking trips (25 percent) have also remained steady since 2013, though other state and city surveys indicate that this percentage may be higher.
- Bicycling trips (2 percent) have remained generally steady since 2013, following a substantial increase from 2006 to 2013, as indicated by other data sources.*
- Transportation network company (TNC) trips (4 percent) have increased significantly from 1 percent in 2014. TNC services include Lyft and Uber.*
*Bicycling and TNC trips have a margin of error of +/-1 percent.
Second-Choice Travel Options
- For people who normally drive, transit was the most popular second-choice option (by far), followed by carpooling, walking and riding a bike.
- For people who normally take transit, the top second-choice options were driving alone (23 percent), using a TNC service (21 percent) and walking (20 percent).
Why People Drive in San Francisco
- People said they choose to drive primarily because they see it as the fastest and most convenient option, and because free or inexpensive parking is available near their destination.
- Where people live continues to be one of the strongest indicators of how likely they are to drive. Those who live in outer San Francisco neighborhoods, and in the North and South Bay, choose to drive for more than half of their trips in San Francisco.
- After location, income continues to be the next-strongest indicator of whether someone will have access to a private auto and choose to drive. Ninety percent of households with annual incomes over $75,000 have access to a vehicle, while for lower incomes, the rate is 60 percent.
TNC Services Continue to Become More Popular
- As noted, about 4 percent of trips are now made using TNCs. About 20 percent of city residents reported using TNCs at least once a week, and 40 percent use them at least once a month.
- Frequent TNC users are more likely to be under the age of 35, have higher incomes and live in San Francisco’s dense, inner neighborhoods. Seven percent of trips by those under 35 are made by TNC, compared to just 2 percent by those over the age of 35.
San Francisco Has a Range of Transportation Options
- Most respondents felt they had a variety of travel options available. Generally, only 15 to 20 percent said they would not make a trip if their preferred travel option wasn’t available.
The shift away from driving means less traffic congestion, cleaner air and other benefits for San Francisco. U.S. Census surveys reinforce our findings and indicate that San Francisco remains a leader among American cities that are working to minimize the impact on their streets as more people commute to work.
At the same time, these findings also show that we have plenty of work to do to make walking, bicycling and transit the most attractive options. With the recent boom in TNC services on our streets, we have to do what we can to ensure that emerging technologies like these complement our city's transportation system and support our vision for a safe, healthy and equitable city.
Achieving that big-picture vision requires changes to our streets to provide amenities like bike lanes, transit lanes and wider sidewalks, and that often means short-term trade-offs, for those who drive.
But as we continue to see in studies like these, these measures work: when we make effective investments in better travel choices, more people use them.
ABOUT TOM MAGUIRE
Tom Maguire is Director of the Sustainable Streets Division at the SFMTA, where he directs the agency’s ambitious efforts to achieve Vision Zero and to create world-class streets for all San Franciscans. The 1,035 employees of Sustainable Streets operate, engineer, design, and plan the city’s traffic, parking, pedestrian and bicycle infrastructure and provide transit security and parking enforcement.
Tom joined the SFMTA in October 2014 after serving as Assistant Commissioner at the New York City Department of Transportation, where he managed bus rapid transit, freight mobility, peak-rate parking, congestion pricing and sustainability, and resiliency programs. He has also worked for the engineering and design firm Arup. Tom holds a Master’s degree in City and Regional Planning from UC Berkeley and a B.A. from Rutgers.