This is the second in a series of blog posts diving into the budget process. The first blog was a high-level overview. This post will discuss the state of our projected revenue and expenditures and how they inform budget development. Future blog posts will include content focusing on:
- Policy objectives and funding priorities
- Overview of our outreach
- Adopted Budget and what it includes
Overview of the Budget
Our state constitution and the city charter both require balanced budgets. This means that as a department of the City and County of San Francisco, we must propose a two-year balanced budget where projected expenditures do not exceed projected revenue.
Revenue refers to the total amount of money that the SFMTA collects or receives, while expenditures refer to the total amount of money that the SFMTA spends to provide services and implement projects. There are two key challenges to be weighed by us, our city partners, and stakeholders when balancing the proposed budget.
- The SFMTA must estimate its revenue and expenditures as far as 24 months in advance. This is going to be particularly challenging given the uncertain economic outlook as a result of COVID-19.
- In many cases, the City Charter and state law restrict how revenue is generated and what collected funds can be spent on. For example, the recently passed Proposition D, a tax on ride-hailing companies like Uber and Lyft, mandates that half of revenue raised go to improving pedestrian and bicycle safety.
Operating Budget
The City Charter mandates that Muni operations, meaning daily service and maintenance, be delivered at specific levels. The funds required to meet the mandated operations levels come from the Operating Budget.
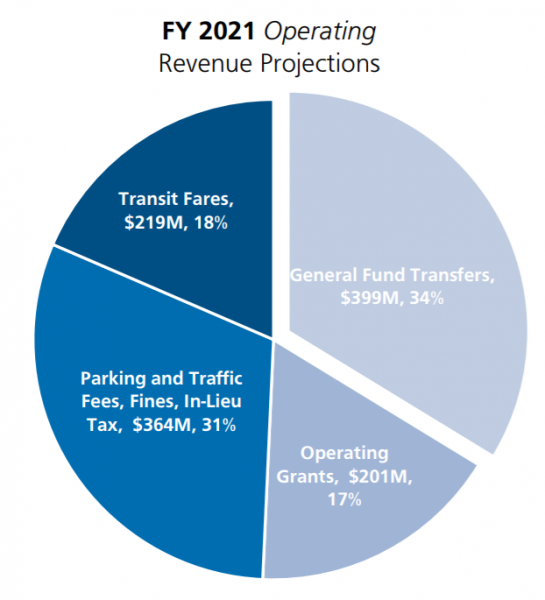
In Fiscal Year 2021 (July 1, 2020 – June 30, 2021), we expect our total Operating Budget to be $1.3 billion. As shown in the pie chart, we have four main sources of revenue: General Fund (34%), Parking and Traffic Fees and Fines (31%), Transit Fares (18%), and Operating Grants (17%).
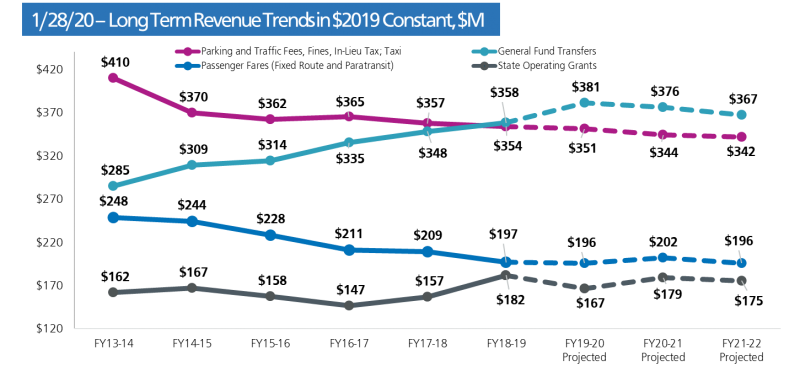
Over the past seven years there has been a meaningful decrease, in inflation-adjusted dollars[1], in two of the main revenue sources: Parking and Traffic Fees and Fines and Passenger Fares.
As shown in the graph below, these declining revenues make the SFMTA increasingly reliant on revenue from the General Fund and state Operating Grants to fund operating costs.
Accessible text for Graphic #2
The General Fund is the total pot of money that the City and County of San Francisco collect from taxpayers throughout the year. The City Charter sets a minimum level of funding from the General Fund that goes to the SFMTA.[2] State Operating Grants come from the State of California’s General Fund through various taxes, mostly on gasoline, and are allocated through various state and regional agencies such as the California Transportation Commission (CTC), California Department of Transportation (CalTrans), and Metropolitan Transportation Commission (MTC). The SFMTA General Fund allocation and state Operating Grants are fairly flexible revenue sources meaning that they can be used for a variety of operating and capital expenditures.
While these two revenue sources provide a large portion of the SFMTA’s overall budget, their size and stability are dependent on the state of the economy and corresponding tax revenues. Reliance on revenue sources that fluctuate with economic booms and busts means that economic downturns will force the SFMTA to reduce service. This is especially true as current revenue sources are expected to decrease significantly due to the Coronavirus pandemic and current shelter-in-place orders.
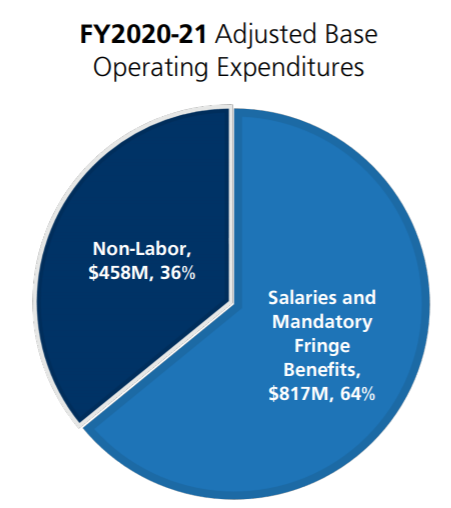
As our main revenue sources have decreased, the SFMTA also faces constantly increasing expenditures, because the costs of maintaining and providing service are increasing. Operating expenditures fall into two categories: labor and non-labor.
Labor expenditures (e.g. employee salaries) are increasing because we need to pay our staff more to keep up with the cost of living. Additionally, the agency’s pension contributions are increasing as the number of retirees increases. Non-labor expenditures (e.g. bus tires) are also increasing because equipment costs and software licensing fees have continuously grown.
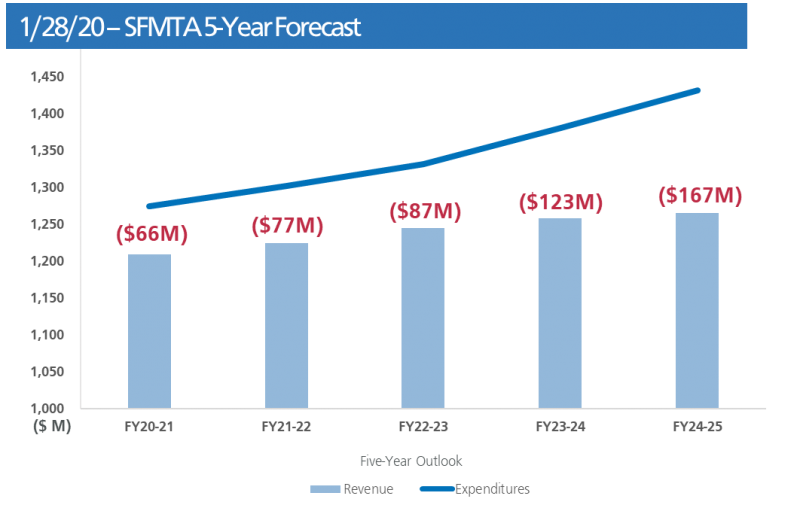
Increasing expenditures and decreasing revenue creates a structural deficit – i.e., revenue is not keeping up with costs. In booming economic times, the agency’s costs go up relative to the cost of living. Our revenue, however, increases slower – only as much as inflation. Overall, our deficit is projected to rise from $66 million in FY2020-2021 to $167 million by FY2024-2025.
Accessible text for Graphic #4
The SFMTA is proposing a suite of policy changes in this year’s budget to achieve our Strategic Plan goals and help address this deficit, consistent with our values. These policy changes are projected to impact revenue and expenditures, bringing the agency to a balanced budget for Fiscal Years 2021-2022. As noted above, our next blog post will discuss these policy objectives and how they align with our funding priorities and values.
Capital Budget
The funds required to build, maintain, and enhance transportation infrastructure -- the vehicles, the rail, and all the physical and technical needs of our transportation system -- are accounted for in the Capital Budget. For example, while the Operating Budget pays for transit operator salaries, the Capital Budget pays for new buses. In Fiscal Year 2021, the agency’s total Capital Budget is projected to be $468 million. This budget includes four main expenses: Transit Optimization and Expansion (31%), Fleet (26%), Transit Fixed Guideway Infrastructure (14%), and Streets (12%).
Creating the transportation system that San Franciscans deserve requires not only expanding and modernizing, but also investing in and improving the current system. Overall, the list of capital needs—the investments required to maintain and expand the current system to meet the SFMTA’s and the City’s transportation goals—far exceeds available funding. When developing the two-year Capital Budget, the SFMTA must consider all capital needs and make tradeoffs between maintaining and expanding our system.
The SFMTA’s medium to long-term projected capital needs for the city’s transportation system, detailed in the 20-Year Capital Plan, have grown by $8.9 billion, to a total of $30.8 billion in 2019. General sources of this increase include realities like the increased costs for constructing projects. For example, in 2016, the average cost to install a traffic signal at an intersection was $400,000. By 2018, however, this number doubled to $800,000. Additionally, cost estimates for streets projects have increased, because we have more of them and they are more extensive in order to meet Vision Zero goals and eliminate traffic fatalities in San Francisco.
Along with escalating projected costs, the investments required to ensure that our current system functions at peak performance, known as the transportation system’s State of Good Repair (SGR) backlog, is growing. The SGR backlog is the replacement value of assets, like our buses, that are older than their estimated useful life. Between 2018 and 2019, the agency’s reported asset backlog rose to $3.23 billion due primarily to the agency’s aging facilities and parking and traffic assets.
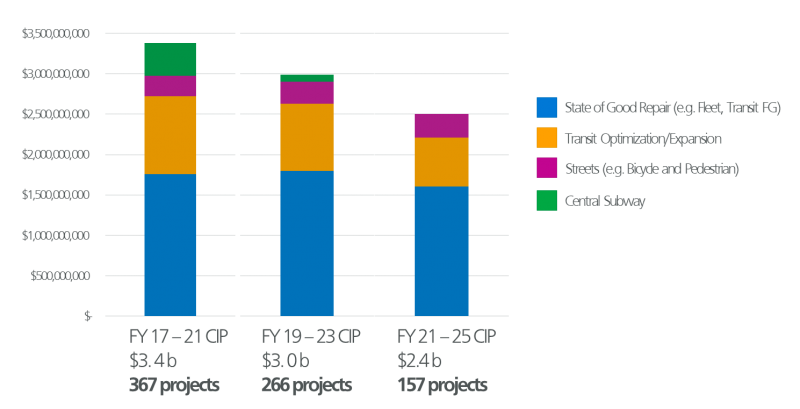
As with the Operating Budget, capital expenditures required to reach our transportation goals are far outpacing available capital revenue. The chart below shows the broad categories of how the agency spends its capital dollars. The majority of the funds are spent on State of Good Repair (e.g. replacement trolley coaches, Islais Creek Facility rehabilitation), followed by Transit Optimization (e.g. Van Ness Bus Rapid Transit, Better Market Street), followed by Streets (e.g. Fulton Street Safety and Transit, Safer Taylor Street).
The chart also shows our expenditures on the Central Subway project. In FY17-21, the Capital Budget was $3.4 Billion. In FY 21-25, the Capital Budget is expected to decrease by approximately 30 percent to $2.4 Billion. This means that the number of projects that the SFMTA can deliver is expected to decrease.
Accessible text for Graphic #5
There are three main reasons for the anticipated fall in capital revenue:
- Central Subway Nearing Completion: a $1.6 billion subway extension connecting Caltrain, under Market Street to Chinatown, is nearly complete. This means that, unlike previous CIPs, we aren’t receiving any additional revenue for this project.
- General Obligation Bond (GO Bond): We have spent nearly all the $500 million of the City and County of San Francisco municipal bond passed by voters in 2014.
- Prop K Sales Tax Expenditure Plan: while the tax itself doesn’t need to be approved again, periodically the voters must approve how these funds are spent. We have spent nearly all the funds approved in the current expenditure plan and must develop a new one.
Looking Ahead
We are facing an operating structural deficit as our expenditures steadily outgrow our revenue. Similarly, the Capital Budget is experiencing declining revenue just as the needs of our system are growing more than ever. These aren’t easily solved problems, but our city recognizes the need to deliver the transportation system that San Francisco deserves. In 2017, Mayor Ed Lee and then Board of Supervisors President London Breed convened Transportation Task Force 2045 (T2045). The task force was responsible for developing and evaluating options for how the city can generate additional revenue for our transportation needs. Several of the options explored by T2045 include:
- Congestion Pricing: a fee paid to drive in designated congested areas. This option wasn’t considered as a revenue-generating tool but as a part of policy package to reduce congestion.
- A Second Transportation Sales Tax: Proposition J and K went on the ballot in November 2016. Proposition J was a charter amendment that would dedicate funding that comes into San Francisco’s General Fund from the Proposition K sales tax measure which included a half cent for transportation. Unfortunately, the joint measures did not pass.
- Transportation Network Company (TNC) Fee: a per-ride fee on TNC rides to help pay for congestion management efforts to mitigate the impacts of TNC trips
This past November one of these potential revenue measures, Proposition D, was approved by the voters. Proposition D is a tax on ride-share companies like Uber and Lyft to provide funding for both the Operating and Capital sides of the SFMTA budget. This tax is estimated to bring in $30 million dollars annually, with half going to capital investments for pedestrian and bicycle safety.
Several of the other revenue sources that might be up for consideration soon include:
- A Second GO Bond: this revenue was not included in the current FY 2021-2025 CIP, a second $500 million GO Bond is scheduled to go to the ballot in November 2022
- Reauthorize Prop K: reauthorizing Prop K by developing a new expenditure plan would provide funding to a wide array of our capital programs.
- Community Benefits District: a tax district that allows communities to raise money for local infrastructure investments and services.
As the agency moves forward with adopting the next two-year budget, we need to continue the dialogue about revenue and expenditures. That includes adjusting to the new economic conditions we find ourselves in today and continuing to support the long-term financial health of the agency with new on-going revenue sources.
Where to find additional information
In the upcoming weeks, we will be publishing additional blogs that will provide more detail on specific aspects of the budget process. For additional questions, please review the following documents or email sfmtabudget@sfmta.com.
- Transportation Task Force 2030
- In 2013, Mayor Ed Lee convened a Transportation Task Force to investigate what San Francisco needs to do to fix our transportation network and prepare it for the future. After a year of study, this committee found that to meet current need and future demand the city needs to invest $10 billion in transportation infrastructure through 2030.
- SF Transportation Task Force 2045
- The Task Force's final report outlines the trade-offs facing our city's transportation system. The report will serve as a resource to help provide an understanding of these trade-offs in order to identify new revenue sources for our city's transportation system.
- SFMTA 20-year Capital Plan (2017)
- This is a fiscally unconstrained assessment of the SFMTA’s anticipated capital needs in the next 20 years. It identifies the investment needed to meet the agency’s and city’s transportation goals, and informs the capital side of each two-year comprehensive budget
- SFMTA State of Good Repair Report (2018)
- Our 2018 State of Good Repair Report provides an overview of the agency’s rehabilitation and replacement needs and investments. It also outlines the agency’s project prioritization, planning, and delivery practices related to maintaining a State of Good Repair.
Coming up next in our series: Policy Objectives and Funding Priorities
[1] Constant dollars is a term that refers to the inflation-adjusted value of a dollar. A dollar in 2020 is worth slightly less than a dollar from 2019 because of rising prices.
[2] This level of funding is adjusted for significant service level increases, like the opening of Central Subway