
The SFMTA monitors bicycle volumes and commute trends citywide through three data collection methods: ACS Commute Data, annual bike counts collected manually at specified locations and automated counters citywide. One year ACS Commute Data displays the most recent bike volume trends for bike mode share citywide. Since 2006 the SFMTA has conducted annual bicycle counts at intersections during the evening peak period in the second week of September to analyze bike volume trends at the same locations annually. Lastly, we have counters throughout the city that continuously collect bike volume data. This data is collected and analyzed together to help inform policy and planning decisions as the agency works towards implementing more complete street designs citywide.
Manual bike counts
In 2018 the SFMTA revised the manual bike count program to improve effectiveness, efficiency, and quality of data captured. After 10 years of annual data collection, manual count locations were reassessed to collect data at intersections that better align with today's bike network. This year we collected data at 37 locations during the AM and PM peak periods of 7-10am and 4-8pm on a single day in October.
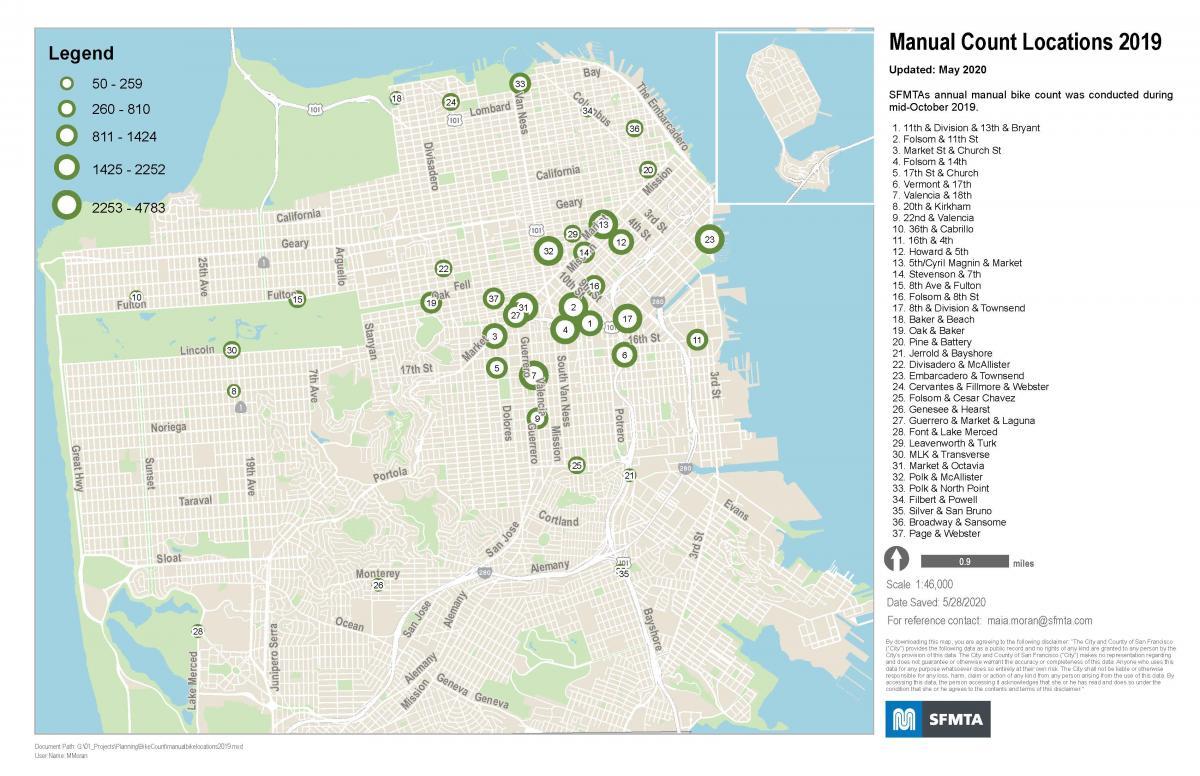
MANUAL COUNT LOCATION MAP
The SFMTA conducted manual counts annually during the second week in September, between Tuesday and Thursday, rain or shine, until 2019. Below is a map of intersections where the counts were collected.
Spatial data for manual bike counts can be found on DataSF, map of manual bike count locations.