Overview
In November 2021, the SFMTA Board of Directors approved the 2021 – 2024 SFMTA Strategic Plan, which documents the vision, mission, goals, and objectives for the agency. Documenting and analyzing bicycle volumes and trends in San Francisco supports the SFMTA’s Strategic Plan Goals, which build upon the city’s Transit-First Policy to prioritize ways of traveling other than driving a car.
The agency’s vision for a sustainable transportation system citywide includes a safe, inviting network of bicycle friendly streets that is easy to use for people of a wide range of ages and abilities. Below, explore our latest report which shows bicycling rates over the past several years, as well as programmatic updates on bikeshare, bike parking, and network expansion.
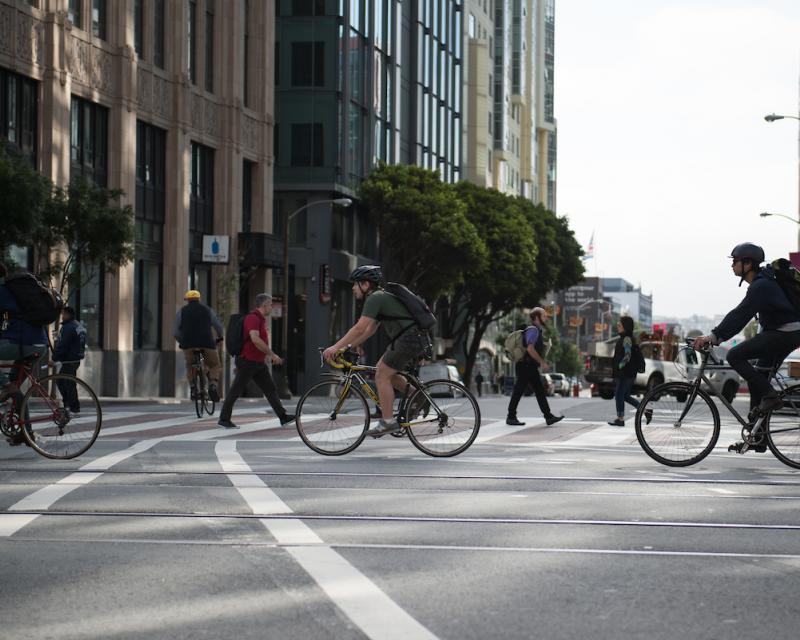
Bicycling moves people around San Francisco using less space per person than when people go by driving. The SFMTA encourages bicycling and makes yearly ridership and trend data public. We’re excited to share that after a dip in bicycling rates during the COVID-19 pandemic, bike ridership is now the highest it’s been since 2019.
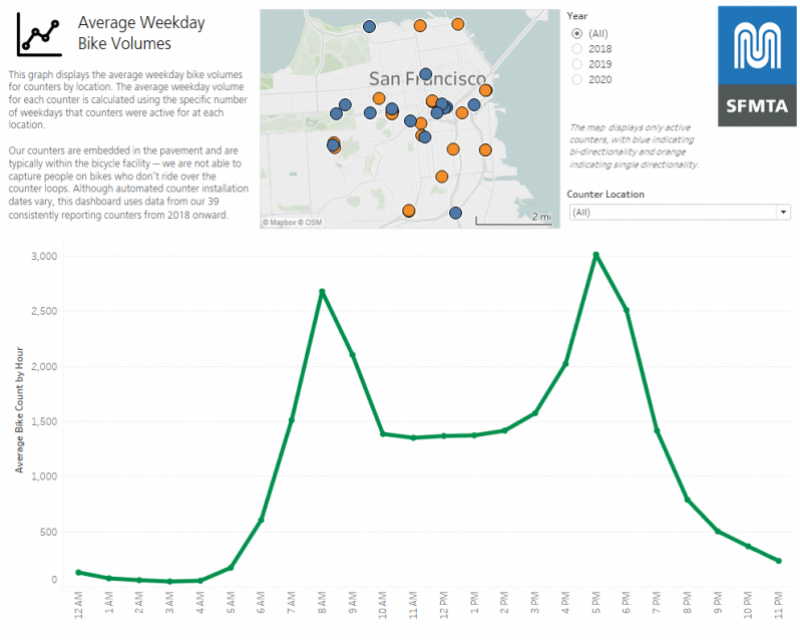
The SFMTA uses a variety of bicycle infrastructure and data metrics as indicators of a healthy and growing bicycle network. As in past years, 2022 data is pulled from the SFMTA’s automated bike counters, annual manual count data, operator-provided bikeshare data, and the US Census. Here are some key findings from 2022 bike data:
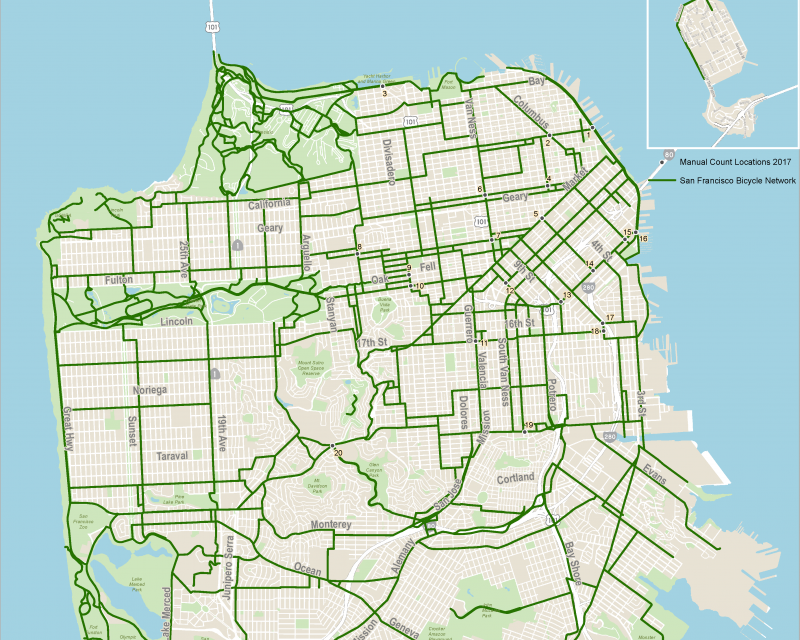
- Streets Made for Biking: In 2021, 17.7 new or upgraded bikeway miles were established, building of 15.3 in 2020. Additionally, the Slow Streets program created 33.8 miles of low-stress, bicycle and pedestrian priority corridors on select residential streets.
- Automated Bike Counts: While in 2021, automated counters clocked 4.7 million bikes in total—a noticeable decline from the 10.8 million counted in 2019—2022 counts are again trending upward!
- Learning to Share: As of spring 2022, there are 280 bikeshare stations across San Francisco—and despite the pandemic, bike share trips have remained steady.
- Bike Parking: Bike parking has dramatically expanded across San Francisco–up from a pre-pandemic yearly average of 328 new racks per year, in 2020, we added 1,024 new racks (2,048 new parking spots), and in 2021, we added 660 new racks (1,320 new parking spots).
For information on the Vision Zero Action Strategy.
For information on the Safe Streets Evaluation Program.